unclepumble wrote:
The Micros might do it like that, the big boys certainly don't guess, all the beers have tolerances that they have to adhere to, or they are not released to market. colour, ABV, Carbonation, Micro, VDK, PG Etc etc etc, all measured on very expensive equipment, in large professional labs frequently.
Yeah, I'm thinking Guinness, John Smiths, Old Speckled Hen etc. I'll have to hunt down some data for these sort of beers.
A quick update...
Whilst the cam-in-a-box seems to work ok (ish), it's a struggle to build the thing and probably not worth the effort in the long run. Although I intend to finish up the software at some point, what I've decided might be a much simpler route is (as GW described) to photograph the standards (the diluted beer samples) along side your 'unknown' beer sample. This should be much more robust, as there is no switching of sample vials, and since everything will appear on the same photograph, all samples will be subject to the same light conditions etc.
So I've knocked up a quick program to grab colour data from a photo, rather than the webcam.
Example:
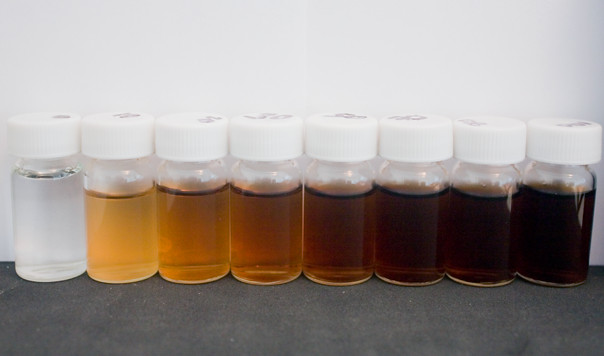
1) Here's a photo I took of my diluted London Stout samples
The 3rd sample from the left is the 'unknown' target beer.
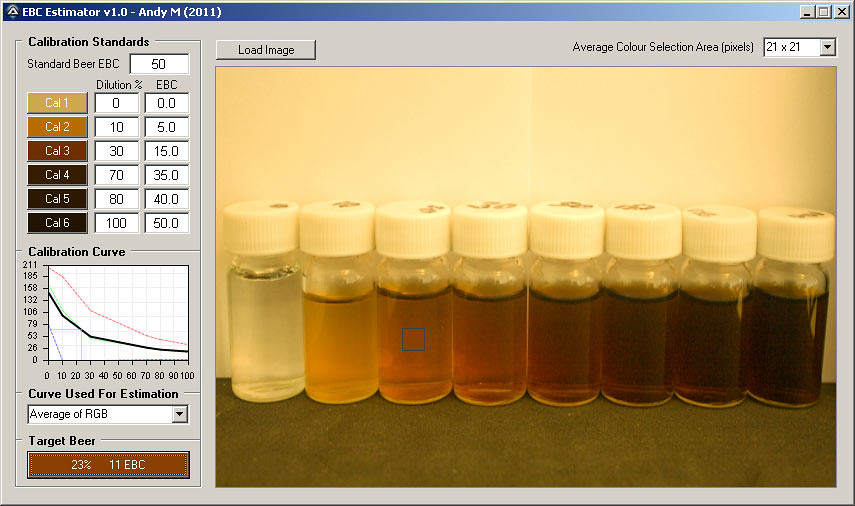
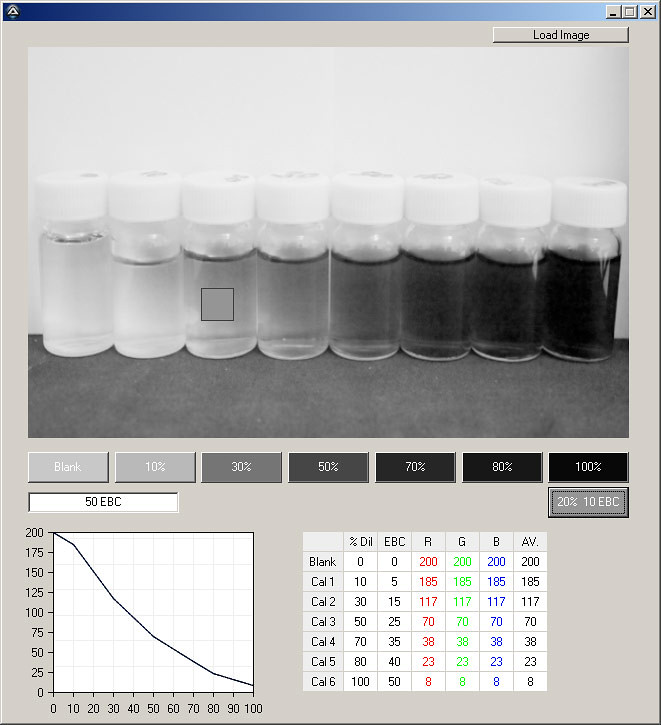
2) Here is the photo loaded into the software
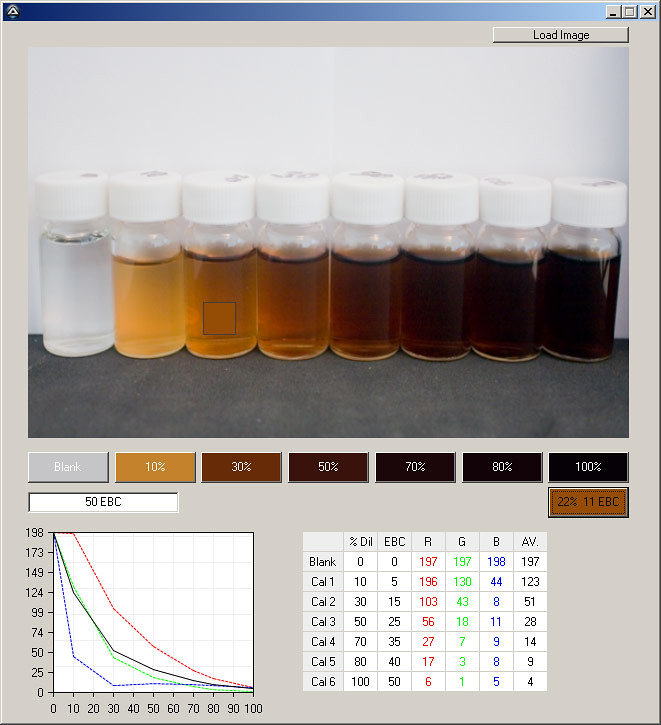
The software works by the user clicking on each sample, and then on the button it represents. When clicking on the sample, a box of pixels is averaged to get the colour of the beer. The idividual channels (RGB) are then used to build up a calibration curve (the graph: x-axis is % dilution, y-axis is colour intensity from 0 - 255). These three curves are then averaged as well to create a single curve from all 3 channels (the black curve in the graph). This is then used to predict/extrapolate what EBC the Target beer will be.
In actual fact the target beer here is just a 20% dilution, which it has picked up as 22% and an EBC of 11 (the button below the 100% button, I really must label my software properly

). Given that beer
does follow Beer's Law, then the actual EBC of a 20% dilution of a 50 EBC stout is...10. So I'm 1 off.
Now, looking at the graph produced, the blue channel is pretty much useless at dilutions between 30 and 100 %.

But that red channel looks pretty good....
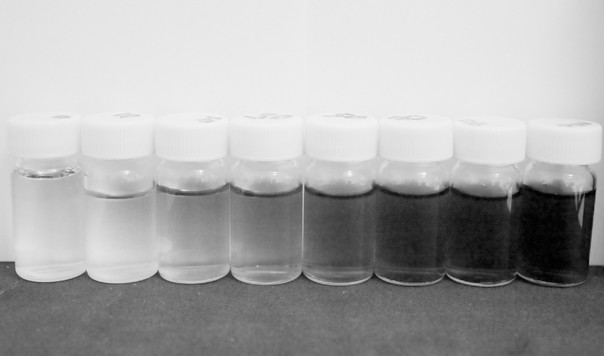
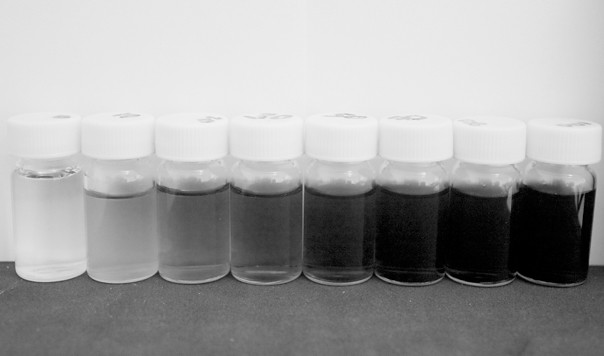
Here are the channels isolated:
RED
 GREEN
GREEN
 BLUE
BLUE
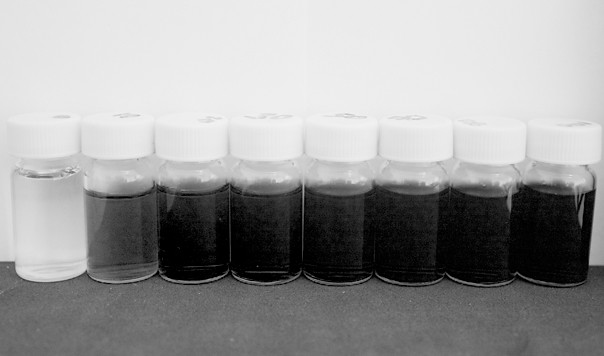
Straight away you can see how all the samples look the same in the blue channel. In the red channel, there is a much better contrast between each dilution.
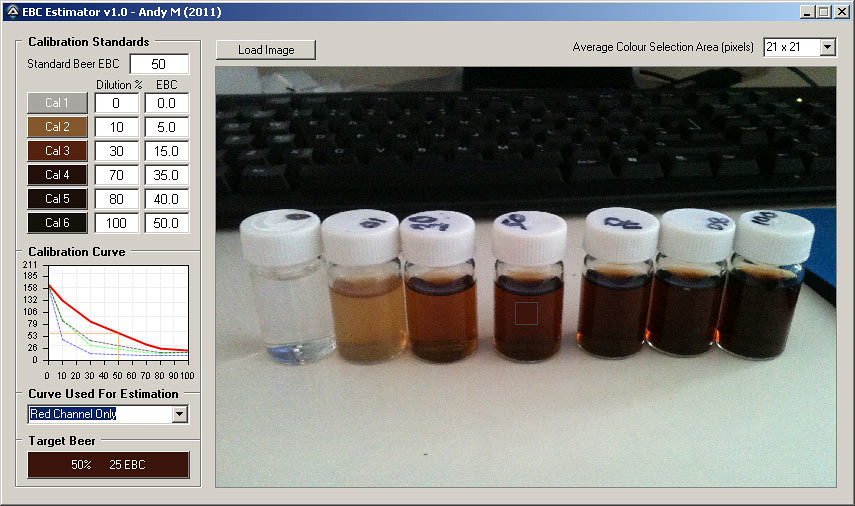
So, loading just the red channel back into the software...
Now the software picks up the 20% dilution perfectly as 10 EBC. In fact, the program picks up the correct dilution for ALL of the samples, with perhaps +/- 1% every now and again.
At this point, this might all seem a bit circular...I tell it what 50% looks like, and then when I click on the 50% sample it sure enough says "50%". But the point here is that a curve is being produced which will allow the estimation of
any dilution/EBC from 0 to 50. It just so happens that I'm limited to my standards at the moment. It's also pretty accurate, at least for this series of stout dilutions. Next step, as I said, is to build up a profile for different beers / styles to see what difference it makes.
Hurry up weekend!